Introduction
Optimizing runtime performance is crucial for ensuring a seamless user experience on webpages. While page loading focuses on initial loading times, runtime performance evaluates a page’s efficiency during active execution. To effectively analyze and enhance runtime performance, developers can leverage the powerful capabilities of the DevTools Performance panel.
This tool provides valuable insights into performance metrics such as CPU usage, memory consumption, and JavaScript execution time. By meticulously examining these data points, developers can identify bottlenecks, optimize code execution, and deliver highly responsive and performant web applications.
Getting started
When profiling web pages using Google Chrome’s Incognito mode, it’s essential to consider the potential impact of extensions on measurement accuracy. Browser extensions can introduce noise into the profiling process, affecting the reliability of collected data. To ensure accurate measurements, it’s recommended to disable or remove any non-essential extensions before profiling. Additionally, providing the URL of the page to be profiled is crucial.
For instance, the following URL (https://googlechrome.github.io/devtools-samples/jank/) can serve as a reference point for profiling purposes, enabling developers to effectively evaluate and optimize the performance of the webpage in question.
Simulating a mobile CPU
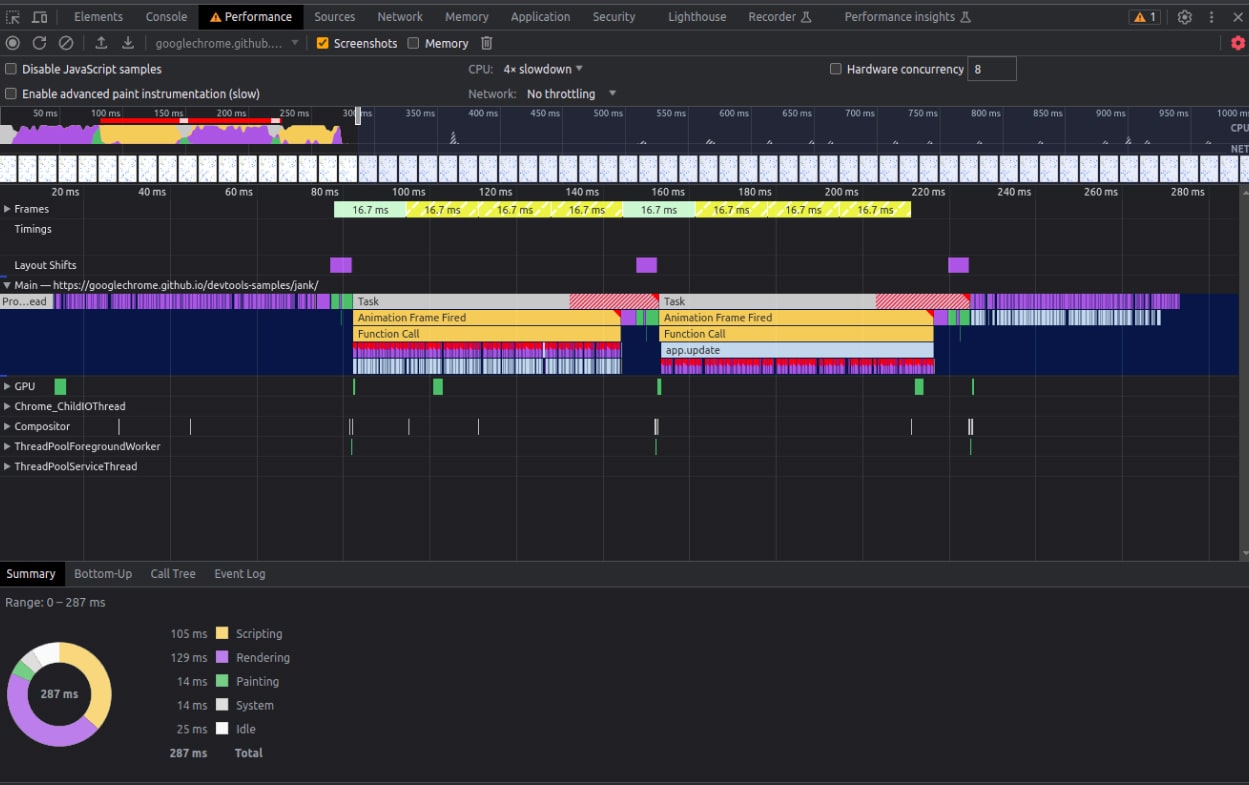
To accurately test and evaluate the performance of a web application on a mobile device, it’s beneficial to simulate a mobile CPU environment. Within the DevTools of a web browser, developers can access the Performance tab to initiate performance profiling. To capture a comprehensive analysis, it’s advisable to enable the Screenshots checkbox, which allows for visual monitoring of the application’s behavior. Additionally, throttling the CPU to x4 speed can help simulate a mobile CPU’s limitations. By emulating a mobile CPU environment with these settings, developers can effectively assess the performance of their web application under conditions that replicate the constraints of mobile devices, aiding in optimizing its responsiveness and overall user experience.
Recording runtime performance
Recording runtime performance in the DevTools of a web browser is an effective approach for capturing and analyzing the performance metrics of a web application. To initiate the recording process, developers can simply click on the “Record” button within the DevTools interface. It’s recommended to wait a few seconds after initiating the recording to allow for a representative sample of the application’s runtime performance to be captured. Once an adequate duration has elapsed, clicking the “Stop” button concludes the recording. This enables developers to obtain valuable insights into various performance indicators, such as CPU utilization, network requests, and rendering performance.
By systematically recording and evaluating the runtime performance of their web applications, developers can identify bottlenecks, optimize code, and enhance the overall efficiency and responsiveness of their software.

Analyzing the results
1. Finding the bottleneck
To effectively analyze the recorded performance results, developers can refer to the summary tab located at the bottom of Image no.1. This tab provides a breakdown of the activity when no events are selected. The primary goal is to identify and minimize the time spent on rendering work. By examining the main section, represented by bars where each bar corresponds to an event, developers can identify bottlenecks. Wider bars indicate events that took longer, and when events are stacked on top of each other, it signifies that upper events caused the lower events.

2. Data recording
To focus on specific events in the recording, developers can zoom in on a single Animation Frame Fired event by clicking, holding, and dragging the mouse over the Overview section, which includes the CPU and NET charts. It’s important to note that the Main section and Summary tab only display information for the selected portion of the recording.
3. Red triangle warning
A red triangle in the top-right corner of the Animation Frame Fired event indicates a potential issue related to that event. Clicking on the Animation Frame Fired event will display its information in the Summary tab. By clicking on the Reveal link, DevTools will highlight the event that triggered the Animation Frame Fired event. Clicking on the provided app.js:94 link will directly navigate to the relevant line in the source code.
4. app.update event and forced reflow/layout
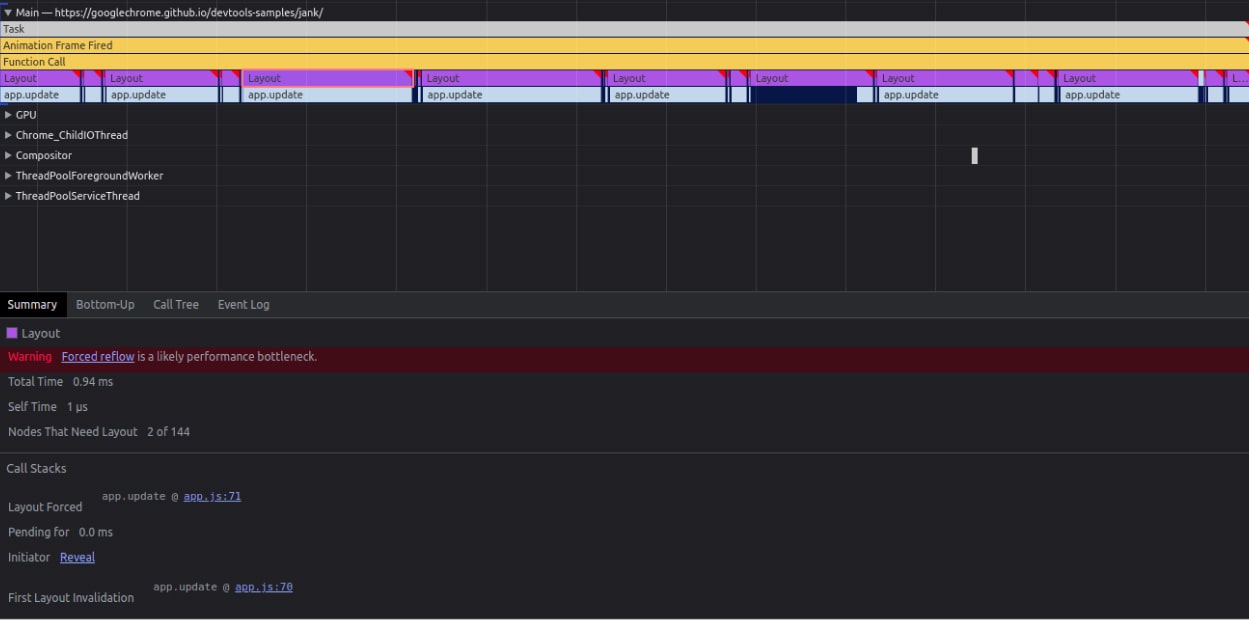
To identify the app.update event and warnings related to forced reflow/layout, click on one of the purple Layout events with a red triangle (each event may have a red triangle). This action will display a warning about the forced reflow/layout.

5. Line of code causing layout
Under the Layout Forced section, click on the app.js:70 link to navigate to the line of code responsible for triggering the layout. This step allows developers to pinpoint the specific code that caused the layout and potentially optimize it for better performance.
Next steps
To enhance your skills and become more comfortable with performance profiling, we encourage you to start by profiling your own web pages. This hands-on approach allows you to gain practical experience and a deeper understanding of how to optimize performance. Additionally, familiarize yourself with the RAIL model, which provides a structured framework for achieving smooth and responsive user experiences.
By following its guidelines, you can prioritize and optimize critical rendering paths. Moreover, exploring how the browser translates HTML, CSS, and JavaScript into the pixels displayed on the screen can be enlightening. Understanding this process helps you make informed decisions when it comes to optimizing code and improving the overall visual performance of your web applications.
Embracing these learning opportunities will empower you to create more efficient and user-friendly experiences on the web.
Helpful tips
- Avoid setTimeout or setInterval for visual updates, use requestAnimationFrame instead
- Move long-running JS off the main thread to Web Workers (either write it on your own or use an npm package. For example in React you can use something like https://github.com/Shopify/quilt/tree/main/packages/web-worker )
- Reduce the complexity of your css selectors, for example BEM methodology (https://css-tricks.com/bem-101/)
- Keep the number of DOM elements and layout triggers to a minimum
There’s a whole lot more to it, but at this point you should have the skills to profile the page and play with all the goodies that DevTools offer us.


